
Working with Oracle Application Express (APEX) was so boring before the APEX version 5 released. It was so hard to do stuff easily. I had to mess around with the style sheet as well as the core configuration files with trying to make changes to the theme and implementing jQuery and other cool features e.g. lightbox etc. This is becoming a very popular product for Rapid Application Development (RAD) now for developing robust and reach web applications with very minimal efforts. This is fast and sleek design works with Oracle Database in the backend. APEX Version 5.x made the UI quite flexible and integrated with the jQuery and Bootstrap framework which made the job easier for the developer to customise the UI and improve the user experience by utilizing the jQuery. Other cool features include dynamic action and installing or building plugins which made the framework more robust.
Anyway, recently I had to implement an interactive map to display assets for a selected location. I could use Google map API for this. But I prefer to use LeafletJs map since it is fast and quite easy to work with considering Google Map API. You know what I mean if you are familiar with the Leaflet Js framework. I have also used jQuery to bind the data to the map.
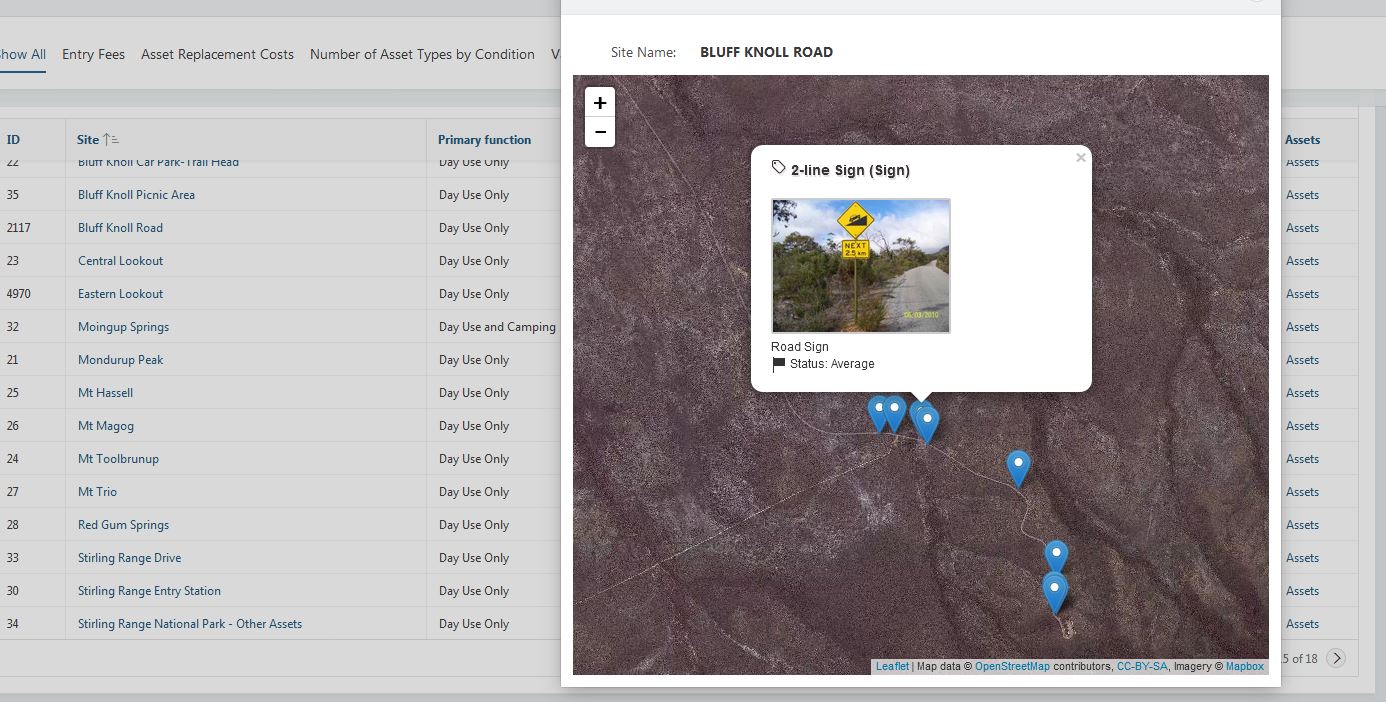
The plan is to build something like the picture below.
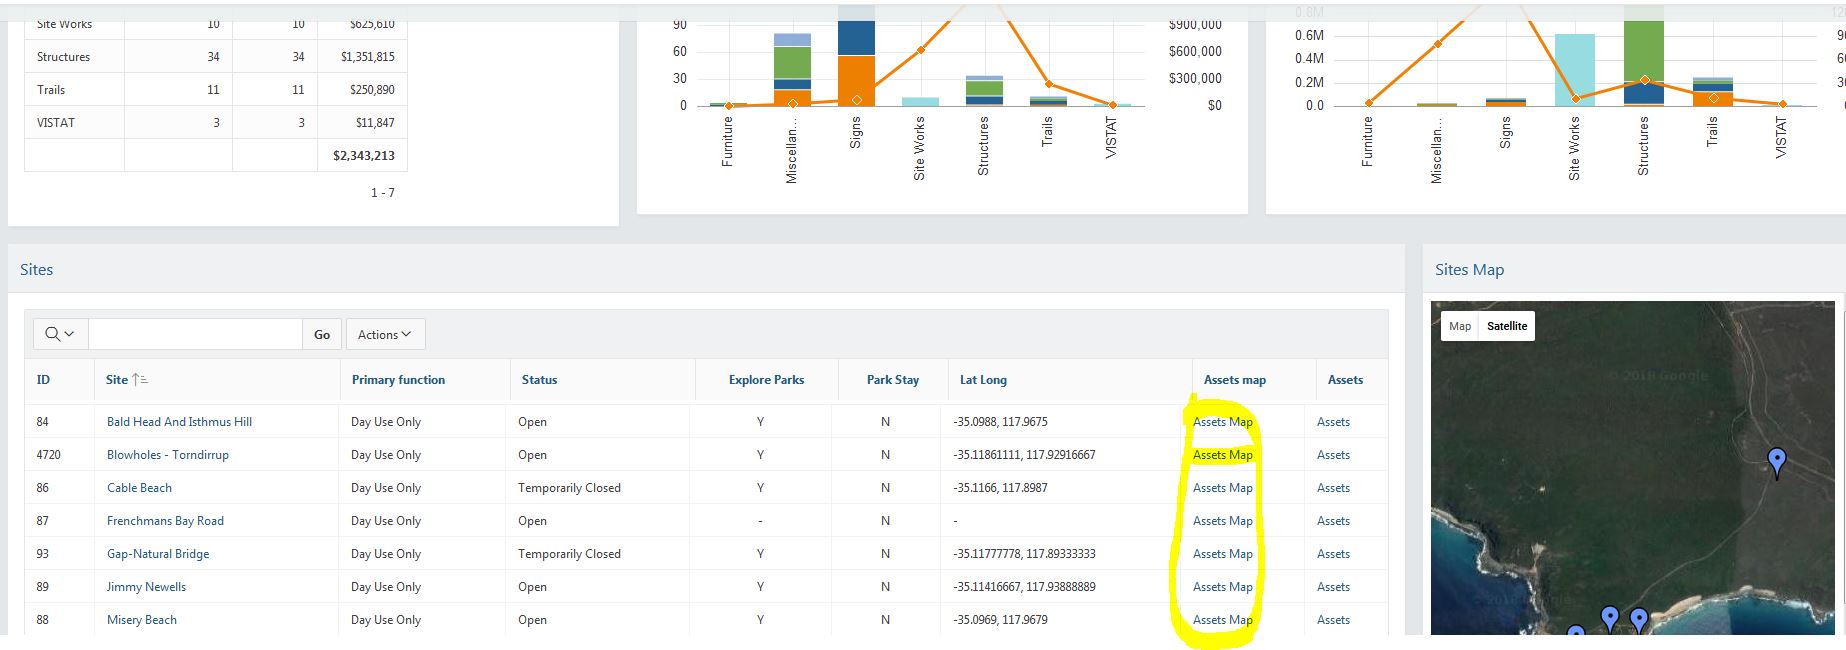
Basically, I want to open the map in a modal and display markers for all the assets for the selected location. When a user clicks on a marker it will then show the info window with more information.
STEP ONE
Login to your APEX workspace. Browse to your application then create a page, in my example, I have created a page with id 200. Make sure you select “Page Mode” to “Modal Dialog” since we want to display this page in a modal window. Once the page has been created. Create a static region to hold the map.
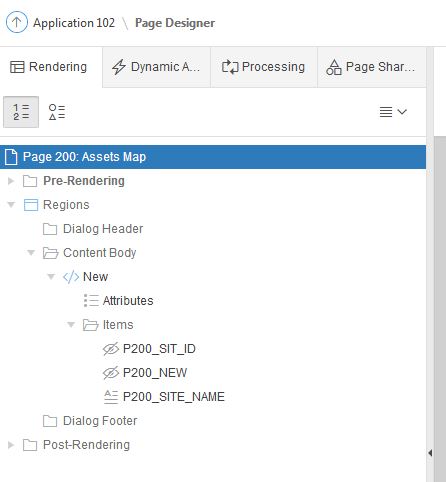
Now create two hidden items and place them inside the static region. See the above picture. In this case, I have created P200_SIT_ID and P200_NEW. P200_SIT_ID holds the foreign key value when passed from the master page through URL setter request. P200_NEW item holds the JSON data which is generated by an application process. This JSON data then processed using jQuery and bind the values in the map.
STEP TWO
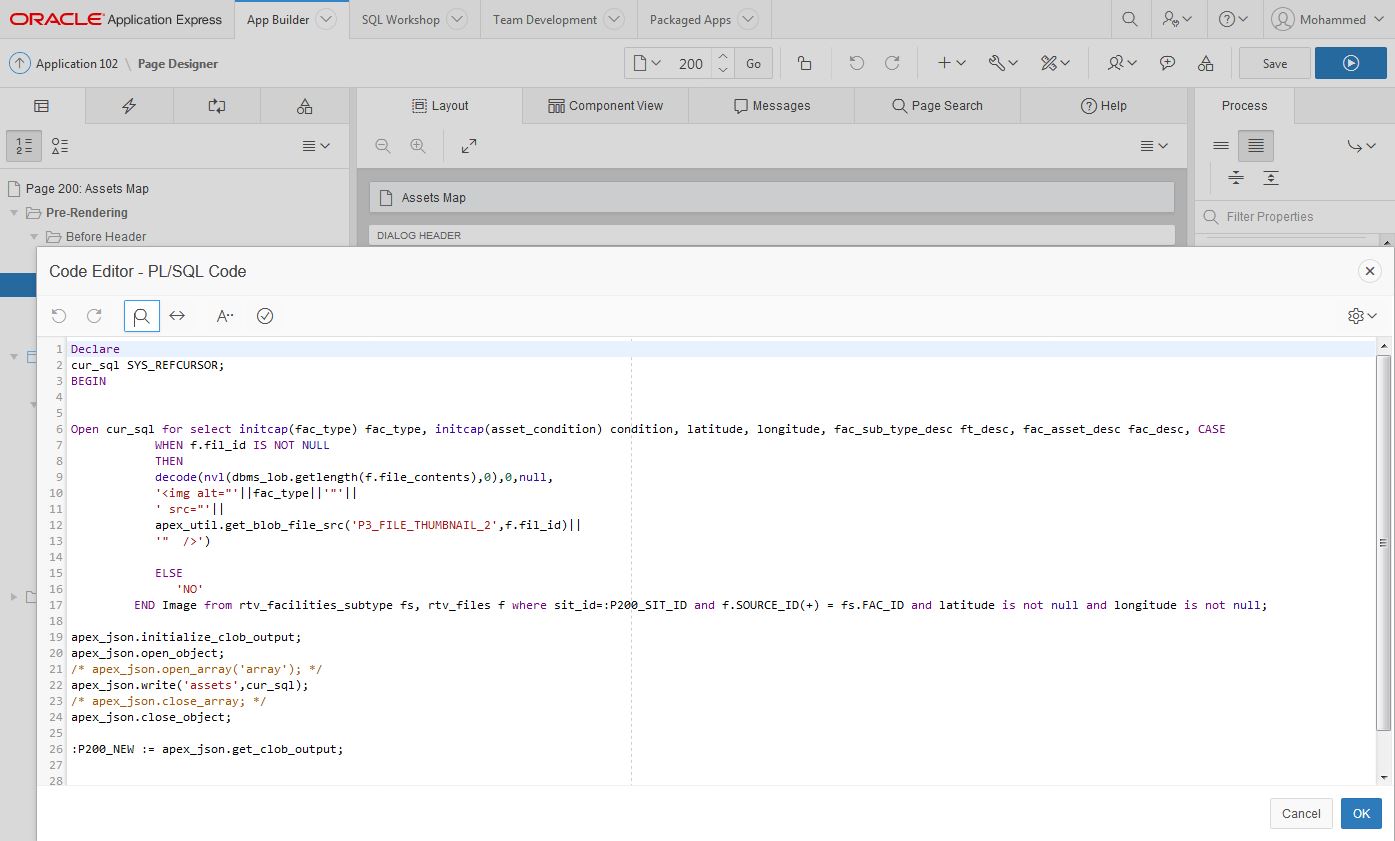
Create an application process to generate the JSON data and store them in the hidden item P200_NEW. I have used APEX_JSON to generate the JSON data. It can be done through external API call if you want to use any middle layer Service-oriented Application (SOA). Ok, create the process using the following parameters –
Type: PL/SQL Code
Source: Type the following code in the source section
Point: Before header
Leave the other options default.
Declare
cur_sql SYS_REFCURSOR;
BEGIN


Open cur_sql for select initcap(fac_type) fac_type, initcap(asset_condition) condition, latitude, longitude, fac_sub_type_desc ft_desc, fac_asset_desc fac_desc, CASE
            WHEN f.fil_id IS NOT NULL
            THEN
            decode(nvl(dbms_lob.getlength(f.file_contents),0),0,null,
            '<img alt="'||fac_type||'"'||
            ' src="'||
            apex_util.get_blob_file_src('P3_FILE_THUMBNAIL_2',f.fil_id)||
            '"  />')

            ELSE
               'NO'
         END Image from tbl_facilities_subtype fs, tbl_files f where sit_id=:P200_SIT_ID and f.SOURCE_ID(+) = fs.FAC_ID and latitude is not null and longitude is not null;

apex_json.initialize_clob_output;
apex_json.open_object;
/* apex_json.open_array('array'); */
apex_json.write('assets',cur_sql);
/* apex_json.close_array; */
apex_json.close_object;

:P200_NEW := apex_json.get_clob_output;


apex_json.free_output;
End;
STEP THREE
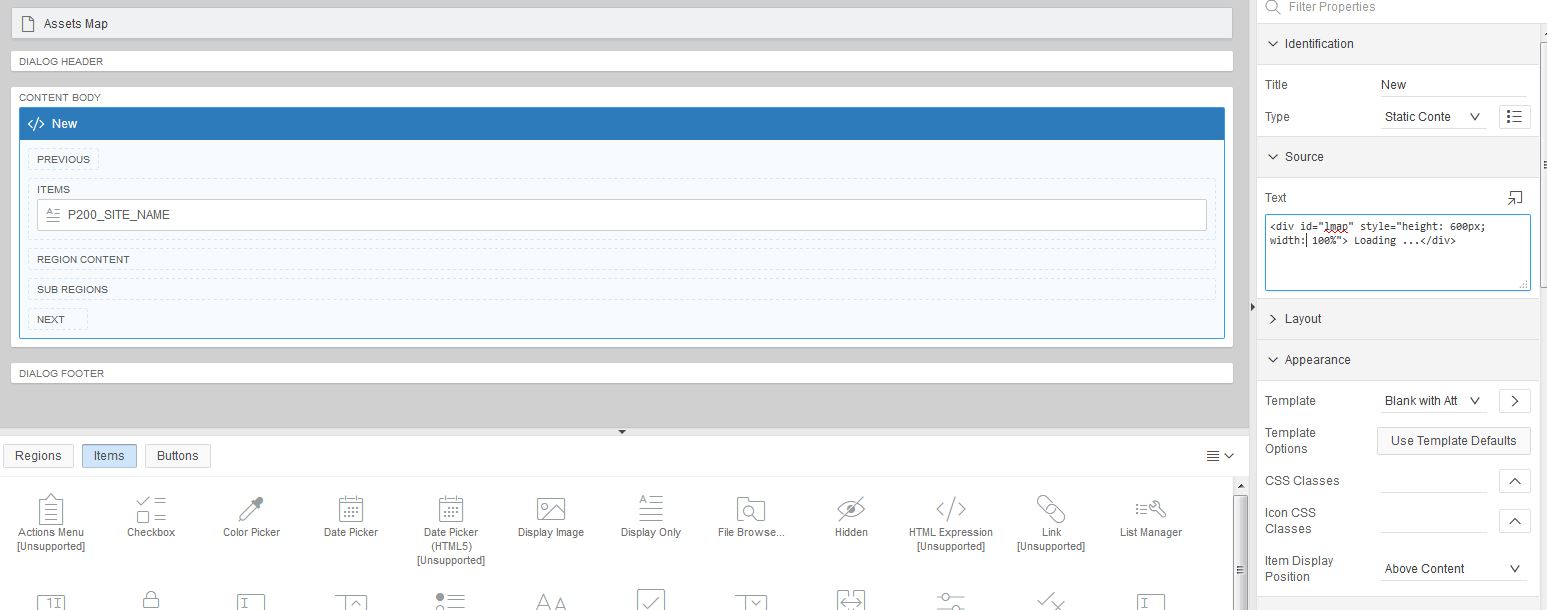
Create a static div with id “lmap” for the map place holder. Select the static region and under the source field enter the following html code.
<div id="lmap" style="height: 600px; width: 100%"> Loading ...</div>
STEP FOUR
Once the application process is created. We can start coupling the javascript code and CSS to make this work. In the footer section of the page, include the leaflet js and jQuery library.
<script type="text/javascript" src="/i/libraries/jquery/2.2.3/jquery-2.2.3.min.js?v=5.1.1.00.08"></script>
<link rel="stylesheet" href="https://unpkg.com/leaflet@1.0.3/dist/leaflet.css"
   integrity="sha512-07I2e+7D8p6he1SIM+1twR5TIrhUQn9+I6yjqD53JQjFiMf8EtC93ty0/5vJTZGF8aAocvHYNEDJajGdNx1IsQ=="
   crossorigin=""/>
<script src="https://unpkg.com/leaflet@1.0.3/dist/leaflet.js"
   integrity="sha512-A7vV8IFfih/D732iSSKi20u/ooOfj/AGehOKq0f4vLT1Zr2Y+RX7C+w8A1gaSasGtRUZpF/NZgzSAu4/Gc41Lg=="
   crossorigin=""></script>
Now, under the “Execute when Page loads” section enter the following javascript.
$(function(){
var str =$('#P200_NEW').val(); //get the json string from the page item;
//samle json data ={"assets":[{"NAME":"MT TOOLBRUNUP","STATUS":"OPEN", "LATITUDE": 32.442342, "LONGITUDE": -114.543534, etc}]};
var arr = JSON.parse(str);
var latlng = L.latLng(-30.81881, 116.16596);
var mymap = L.map('lmap', { center: latlng, zoom: 12 });
L.tileLayer('https://api.tiles.mapbox.com/v4/{id}/{z}/{x}/{y}.png?access_token=pk.eyJ1IjoibWFwYm94IiwiYSI6ImNpejY4NXVycTA2emYycXBndHRqcmZ3N3gifQ.rJcFIG214AriISLbB6B5aw', {
maxZoom: 16,
attribution: 'Map data © <a href="http://openstreetmap.org">OpenStreetMap</a> contributors, ' +
'<a href="http://creativecommons.org/licenses/by-sa/2.0/">CC-BY-SA</a>, ' +
'Imagery © <a href="http://mapbox.com">Mapbox</a>',
id: 'mapbox.satellite'
}).addTo(mymap);
if(arr.assets.length <= 0)
{
//display message when the array is empty
alert("No assets found with valid GPS a coordinates!");
return false;
}
$.each(arr.assets, function(i, item ) {
// loadMap(parseFloat(item.FAC_LONGITUDE_DEC), parseFloat(item.FAC_LATITUDE_DEC));
// alert( item.FAC_TYPE + " " + item.FAC_ASSET_STATUS + " lat: " + item.FAC_LATITUDE_DEC );
var imgT=item.IMAGE;
var marker = L.marker(L.latLng(parseFloat(item.LATITUDE), parseFloat(item.LONGITUDE)), { title: item.FAC_TYPE });
var popupContent = "<div class='infoDiv'><h3><i class='fa fa-tag'></i> " + item.FT_DESC + " ("+ item.FAC_TYPE + ")" + "</h3><p>"+ imgTag + "<br />" + item.FAC_DESC +" <br /><i class='fa fa-flag'></i> Status: " + item.CONDITION + "</p></div>";
marker.bindPopup(popupContent);
mymap.setView(new L.LatLng(parseFloat(item.LATITUDE), parseFloat(item.LONGITUDE)), 12);
//display popup
mymap.addLayer(marker);
});
mymap.invalidateSize(true);
//L.marker([lon, lat]).addTo(mymap);
mymap.scrollWheelZoom.disable();
});
To set the styling for the map callout window I have used the following css inline style code under the “Inline” section of the page properties.
.infoDiv {
    max-height: 500px;
    height: auto;
    width: 300px;
    background-color: white;
}
div.infoDiv >p >img { width: 180px; border: 2px solid #CCC; -moz-border-radius: 2px; -webkit-border-radius: 2px; }
div.infoDiv>h3 { font-weight: bold; font-size: 14px; text-shadow: 1px 2px #e6dede; }
div.infoDiv>p>i.fa { vertical-align: middle !important;}
You can adjust the style as you like to override the default styling.
Here you go now you have fully interactive leaflet map inside the Oracle APEX application from JSON data without using any external API.
[note title=”Optional Title”] APEX page item has a limitation on holding the max number of characters. It might not work if you have a large dataset, I mean if the json string is too long. It worked for me for about 60 markers.[/note]
Hi, I did everything the tutorial says but I found an error with the plsql and it is because it does not recognize the table tbl_facilities_subtype fs, and tbl_files. How can that be corrected?
Hi, thanks for the very useful post.
I have a question – much obliged if you could help:
I have 400 rows in a static (read-only) APEX (19.1) table with a “GEOM” column (SDO_GEOMETRY, polygons+multipolygons), “ID” (integer), “NAME” (varchar2(64)), “C_LAT”, “C_LON” (number (10,2), the coords of the polygon’s centroid.
How can I add id as a layer in Leaflet?
Thank you very much for your time
Greg
Hi Greg,
If I understand you correctly, you want to use ID for makers on the map layer. In that case, you can use ID instead of FAC_TYPE in the marker title.
var marker = L.marker(L.latLng(parseFloat(item.LATITUDE), parseFloat(item.LONGITUDE)), { title: item.ID });Hi, thanks for the answer.
No, I’m not looking to create a marker layer (already done that).
I want to create a layer of polygons, reading data (the polygons) from an oracle spatial table.
Does anyone know if there is a possibility to implement leaflet in APEX 4.2. Because right now it doesent work that way.